

Reading Your Numbers: Brand Video Analytics Inside Versely
A working guide to brand video analytics inside Versely: per-post engagement metrics, account overview, AI trend analysis, and turning numbers into next week's videos.
Most brands publish videos the way people buy lottery tickets: post, hope, forget. The team ships eight clips a week, someone screenshots a view count in Slack when one pops, and nobody can tell you why clip 5 did 40x clip 4. The information exists — every platform reports it — but it's scattered across five native dashboards that nobody opens after Wednesday.
Versely's analytics exist to collapse that loop. Because publishing happens from the same place as generation — you connect Instagram, TikTok, YouTube, and the rest, then post or schedule directly — the performance data flows back to sit next to the content that produced it. This guide walks through what's actually there, and more importantly, the reading habits that turn the numbers into next week's creative decisions.
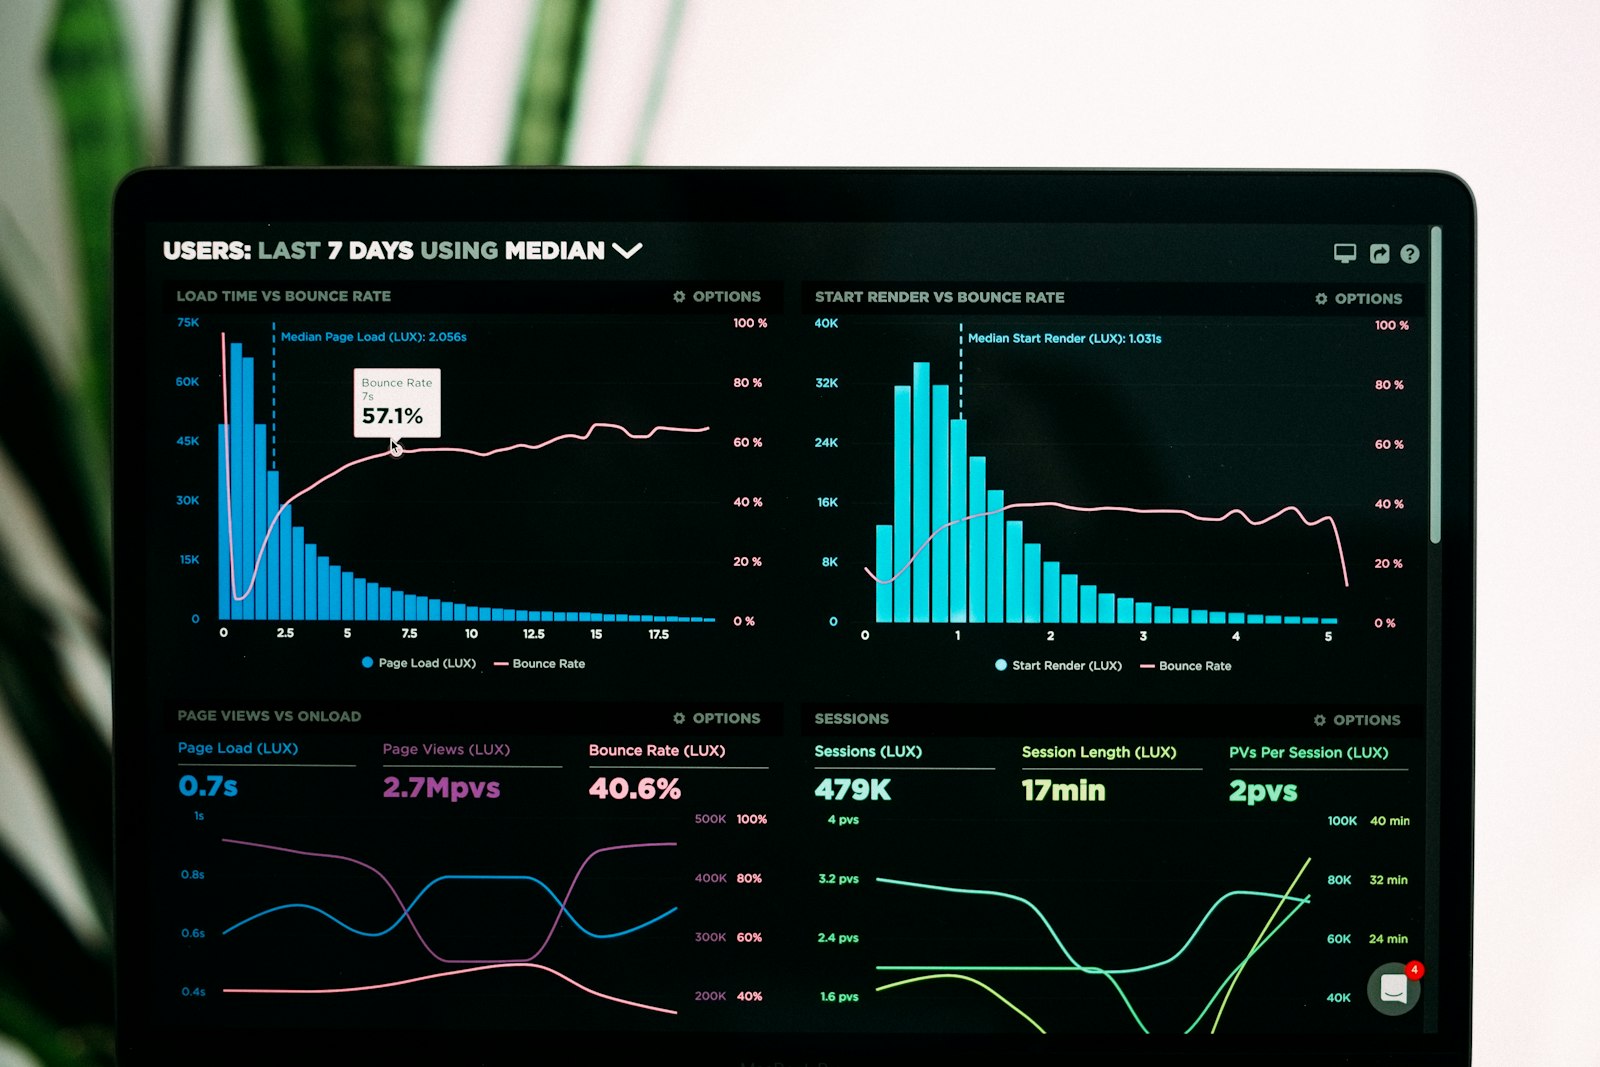
What Versely tracks, in plain terms
Three layers, from narrow to wide:
- Per-post engagement metrics. For each post published through Versely, you get the engagement picture — views, likes, comments, shares — with history over time, not just a snapshot. The history matters more than the totals: a post that's still accruing views on day 6 is algorithmically alive; one that flatlined at hour 8 is done.
- Account-level overview. The rollup across your connected accounts: how the whole operation is trending rather than any single post. This is where you catch slow drift — the four-week softening that no individual post makes visible.
- AI trend analysis and the trending feed. The outward-facing layer: research into what's currently working across TikTok, Instagram, YouTube, and Twitter, plus AI analysis of trending content. This is the input side of the loop — what to make — where the first two layers are the output side — what worked.
The structural advantage isn't any single metric; platforms report richer native data than any third-party tool ever will. It's adjacency. When the video, its generation settings, and its performance history live in one place, "make three more like the winner" stops being an archaeology project.
The weekly reading ritual (15 minutes, honestly)
Analytics tools fail through ambition — 40 metrics, zero decisions. Here's the reading order I recommend, once a week, same day each week:
- Sort last week's posts by views. Look only at the top and bottom two. The middle is noise.
- For the top posts, ask "what was the hook?" Write the first-three-seconds concept down in a running doc. You're building a private library of hooks that work for your audience, which beats any generic hooks list within about eight weeks.
- For the bottom posts, check the shape of the decay. Died instantly: hook problem. Decent start, no shares or comments: payoff problem. Never got impressions at all: possibly topic/format fatigue — the platform pre-filtered you.
- Glance at the account overview trend. One question: is the four-week line rising, flat, or falling? That's your only strategic signal; everything else is tactics.
- Pick one hypothesis for the coming week. "Question hooks beat statement hooks for us" — then deliberately make three of each. Analytics without a weekly hypothesis is just scoreboard-watching.
Comments and shares outrank likes — weight them that way
All engagement is not equal, and the platforms' own distribution systems agree. A workable private weighting for brand accounts:
| Signal | What it actually indicates | Weight it |
|---|---|---|
| Views | Distribution, mostly platform-controlled | Context only |
| Likes | Passive approval | Low |
| Comments | The content provoked a response | High |
| Shares | Someone staked social capital on you | Highest |
| Follows from post | The content promised more | High for brand growth |
The practical consequence: a 4,000-view post with 60 comments is a better template for your next batch than a 90,000-view post with silence under it. The second one caught a distribution wave; the first one built an audience. Chase the first.
Closing the loop: from number to next video
This is where Versely's all-in-one shape pays off. A concrete loop that runs in a single sitting:
- Weekly review says your "3 mistakes" format with a talking-head open is your comment magnet.
- Use the trend analysis side to check what's rising in your niche this week — the trending feed walkthrough covers how to mine it daily, and the trend analysis tool guide shows how to reverse-engineer a specific viral video's structure.
- Generate three new variants of the winning format with the AI video generator — same skeleton, new topics pulled from the trend research.
- Schedule them for your proven posting windows, directly from Versely to your connected accounts.
- Next week, their numbers land in the same dashboard, and the loop turns again.
For formats you've validated repeatedly, promote them out of manual production entirely: build them as reusable workflows that run on a schedule and auto-post. Then your weekly analytics session governs a mostly-automated pipeline — you're steering, not rowing.
Reading trend data without becoming a trend zombie
The trending feed is a research instrument, not an assignment sheet. Two reading disciplines keep it useful:
- Read for structure, not subject. When a video trends, ask what's transferable: the pacing, the hook grammar, the format skeleton. A trending pet video contains a reusable structure even if you sell accounting software. AI trend analysis accelerates exactly this — decomposing why something worked rather than just showing you that it did.
- Cross-reference against your own data. A rising format that matches your existing comment-magnet patterns is a green light. A rising format that contradicts everything your audience has ever rewarded is a small experiment, not a pivot.
Brands that skip the second discipline end up with feeds that look like everyone else's — trend-shaped, audience-free.
Common misreadings to avoid
- Judging posts in 24 hours. Short-form distribution often comes in waves; day-3 and day-6 resurgences are common. Give posts a week before verdicts.
- Treating a viral outlier as the new baseline. One 500k-view post doesn't reset expectations; the median of your last 20 posts is your real baseline. Measure improvement against that.
- Optimizing every post for the same goal. Reach posts, comment-bait posts, and conversion posts have different success metrics. Tag which job each post was doing before judging whether it did it.
- Ignoring posting-time noise. Before concluding a format failed, check whether it posted into a dead window. Consistent scheduling — easy when you schedule from Versely — removes this variable entirely.
FAQ
What analytics does Versely provide for published videos?
Per-post engagement metrics with history over time (views, likes, comments, shares), an account-level overview across your connected platforms, AI trend analysis, and a public trending feed for researching what's working on TikTok, Instagram, YouTube, and Twitter. It covers posts published through Versely's social publishing.
Which platforms can I connect for publishing and analytics?
Versely's social publishing supports Instagram, TikTok, YouTube, Twitter/X, Facebook, LinkedIn, Pinterest, Bluesky, and Threads — you can publish immediately or schedule, and performance data for published posts flows back into the analytics view.
Which metric matters most for brand videos?
Weight comments and shares above views and likes. Views measure distribution the platform chose to give you; comments and shares measure whether the content provoked response and earned social capital — which is what compounds into an audience. A low-view, high-comment post is a better creative template than a high-view, silent one.
How long should I wait before judging a post's performance?
A full week. Short-form distribution arrives in waves, and day-3 or day-6 resurgences are common. The decay shape over that week — instant death vs. slow burn — tells you more than any 24-hour total.
How do I turn analytics into better videos?
Run a weekly 15-minute review: identify your top and bottom two posts, extract the hook and format patterns from winners, form one testable hypothesis, and generate next week's batch around it. The point of analytics is a weekly decision, not a dashboard habit.
Connect an account, publish this week's batch through Versely, and let the numbers accumulate where your content lives — start with the AI video generator, plans start at $9 a week on pricing.